Fertilisers and agrochemicals
9 out of 100 — this is how much the sector's companies influence the choice that AI shapes0 — the buyer never sees you, 100 — you are recommended first
The sector splits into concrete categories where companies compete for the buyer's choice.
For every category we measure where companies stand on the target markets — to find growth points, influence the choice and grow the share of an export category.
Pick a subsector → category → target market.
Subsectors
Categories with an open study are clickable — drill down to the market and the decision journey.

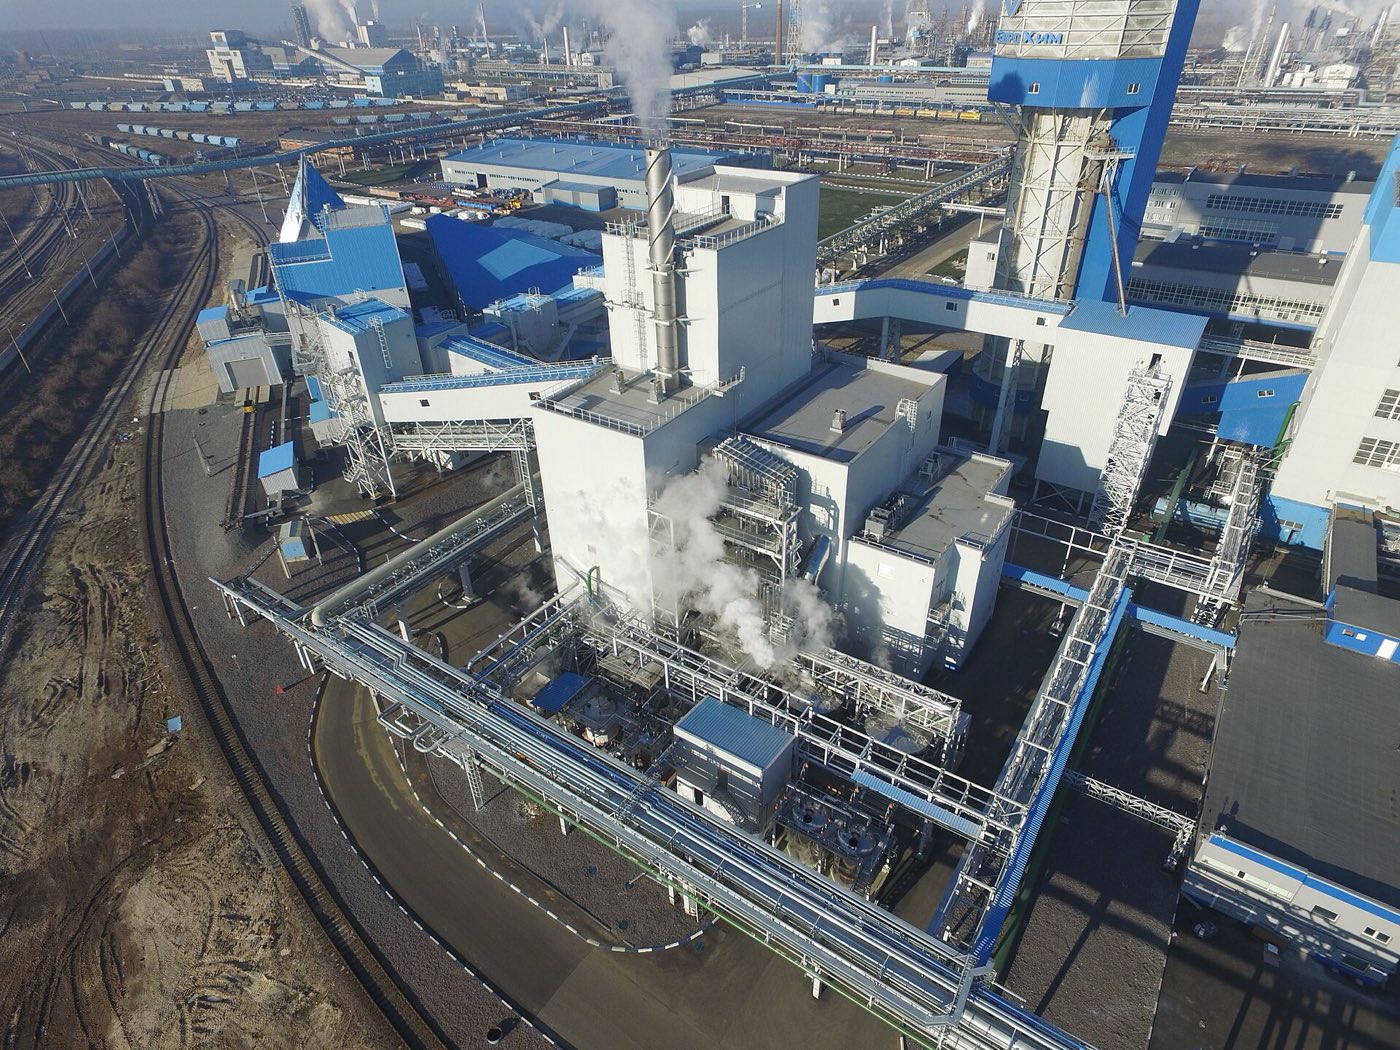
Urea and ammonium nitrate · the industry's largest export flow.
Objects commodity · product · company
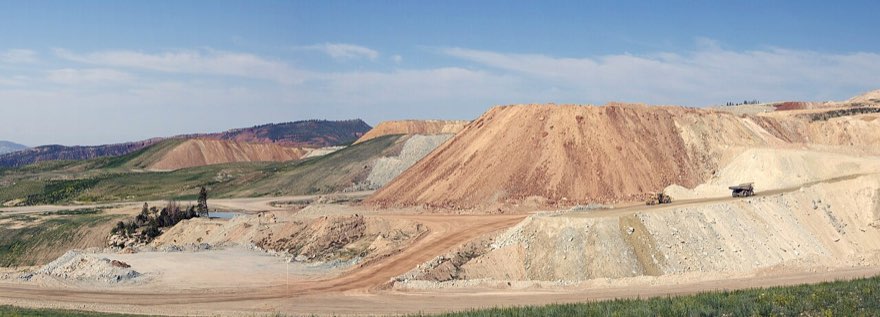
DAP / MAP · a core subsector of the research programme.
Objects commodity · product · company
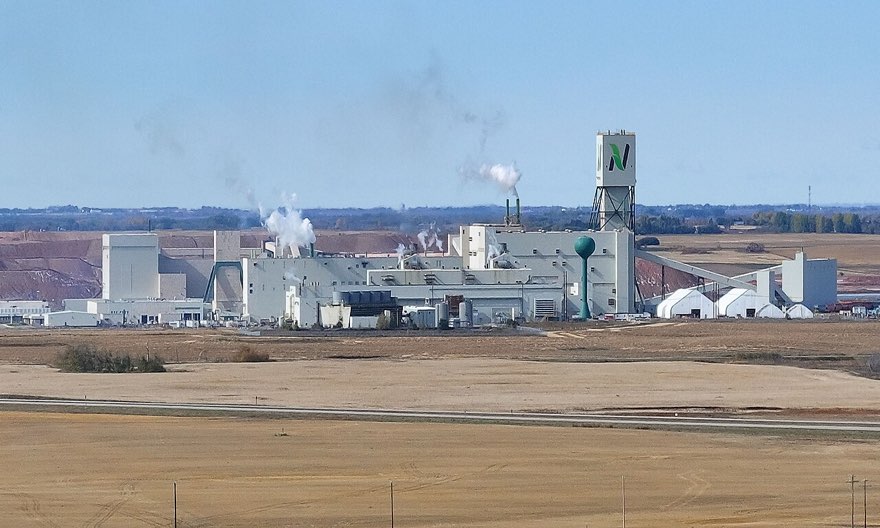
Potassium chloride · a highly concentrated world supply.
Objects commodity · product · company
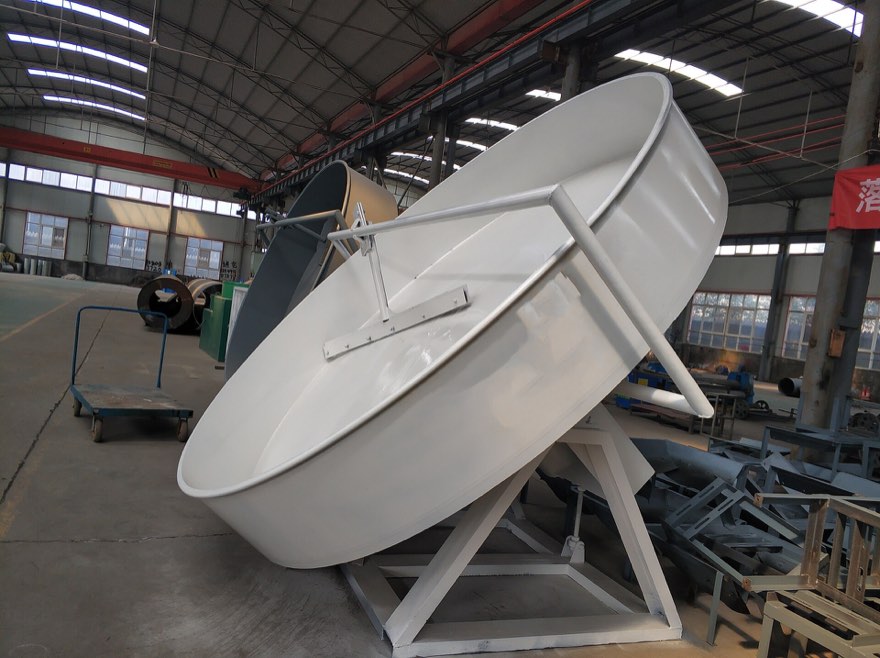
Multi-nutrient formulations · competing with Yara in premium markets.
Objects product · grade · company
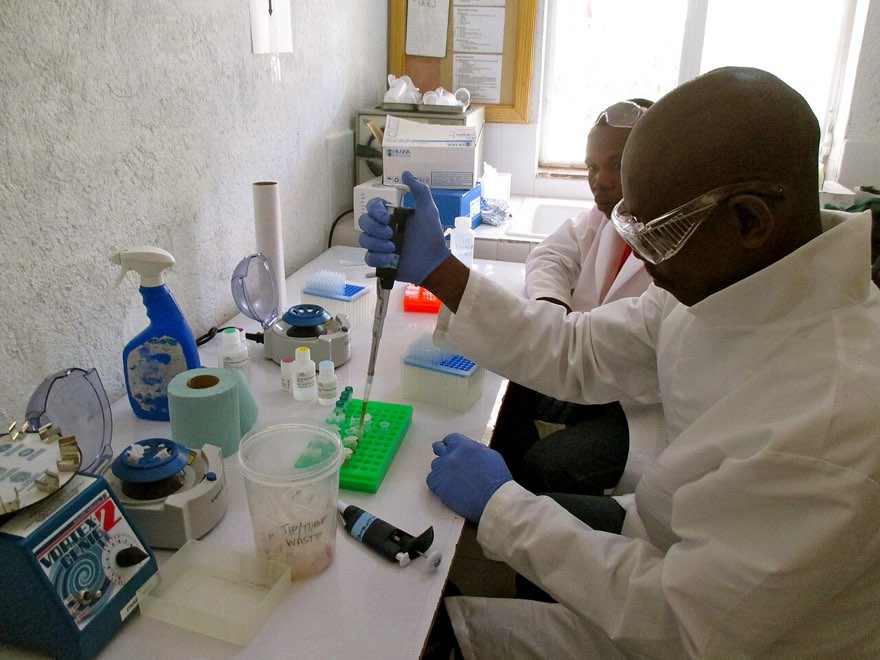
Micronutrient formulations for precision farming.
Objects product · company
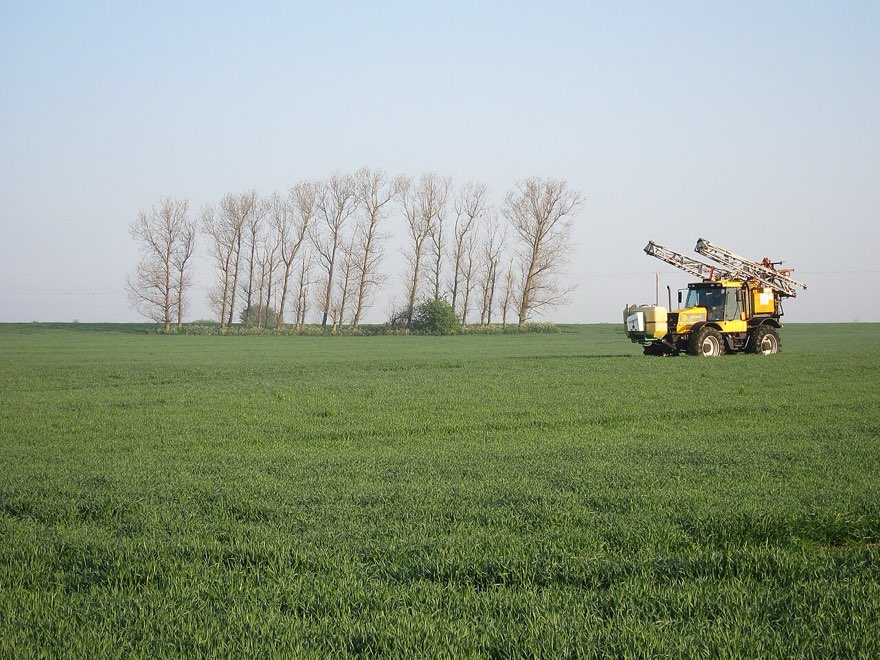
Pesticides · global brands dominate.
Objects product · brand · company
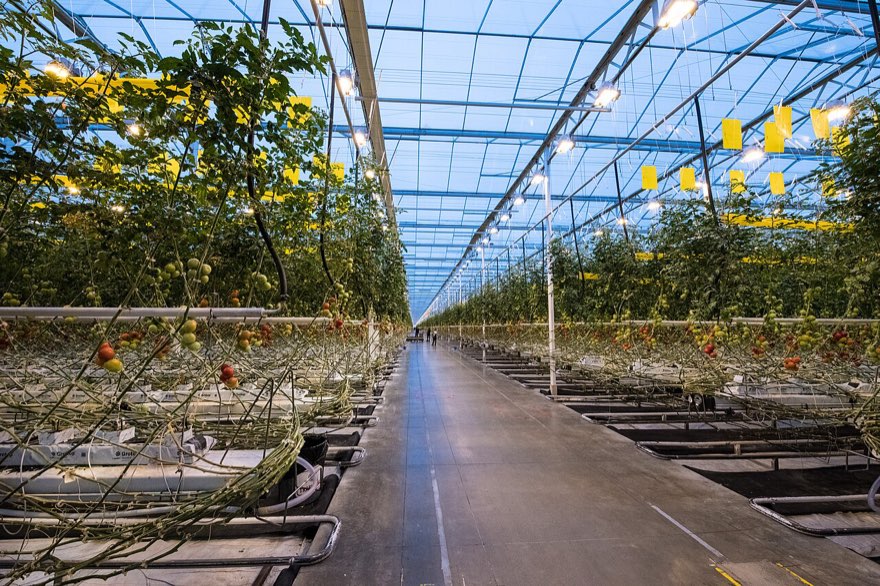
Biologisation of agricultural technology · a growing segment.
Objects product · brand · company
Priority studies
Study = category × market × buyer. Deep analysis is run only for the top of the portfolio.
Typical choice scenarios
Economic situations in which the choice actually happens in this sector.
- 01Choosing a supplier for the purchasing cycle
- 02Choosing a fertiliser for a specific crop
- 03Comparing suppliers on price, logistics and quality
- 04Looking for an alternative supplier
- 05Choosing a formulation for the soil conditions
- 06Building a shortlist for an importer or distributor
Company ranking in AI choiceThe universe is rebuilt on every category scan — the set and order of companies change between measurement waves. The rank is the position in the full universe of the selected market.
Choice Control Index (CCI) of each object on the selected market — participation and win rate combined. Russian objects are flagged.
Tile area is proportional to the position in AI choice, colour marks the zone. Click a tile to open the company's release.
Who this measurement is for
Portfolio priorities for this sector are approved at the level of the responsible authority.
Fertilisers and agrochemicals
Lead the industry's research at GolOps Research. Develop the direction's categories and markets and publish work under your own name.
Authorship stays with you. If a project grows out of the direction's studies, you get a share of its revenue; if the project needs your expertise, you can join it as a paid expert.
MarketsBrazil · India · Turkey · UAE
Authorship · share in commercial projects · Terms of participation are fixed before the study startsPhoto: LEhAN (CC BY-SA 3.0), Jason Parker-Burlingham (CC BY 2.0), Quintin Soloviev (CC BY 4.0), MingChuan Fertilizer machinery (CC BY-SA 4.0), SuSanA Secretariat (CC BY 2.0), Hugh Venables (CC BY-SA 2.0), Lance Cheung/USDA (Public domain)